 Published: 19. November 2025
  Updated: 26. November 2025
 Custom Dashboards for Reports
More possibilities, more clarity, and more of what you really need. With the new Custom Dashboards, you can now shape your Reports section exactly the way you want.
From now on, you can create your own KPI dashboards, combine different widgets, and build your analyses using extensive filters tailored to your needs.
What’s new?

You can still monitor the same metrics you’re used to in Reports — but with Custom Dashboards, you now have full flexibility in how you track your social media performance. This allows you to build individual data stories for various use cases:
Create your own dashboards: Add a new dashboard with just one click and choose exactly which KPIs you want to keep an eye on.
Arrange widgets individually: Build your dashboards with the following widgets and place them anywhere you like:
- Fans & Followers Summary
- Fans & Followers per Channel
- Post Performance
- Post Performance Summary
- Post Performance per Channel
Exports & automated reports: You can now export dashboards as PDF or Excel — or schedule automated report deliveries via email at regular intervals.
Update 26.11.2025
We just added some more widgets to Dashboards. Now you can also add the following to your Custom Dashboards:
- Post Comments Summary
- Post Comments per Channels
- Private Messages per Channel
- Mentions Comments per Channel
How it works
- Create and customize dashboards
Click on “Add Dashboard” and give it a title. You can change the dashboard name at any time by clicking the edit (pencil) icon next to it.
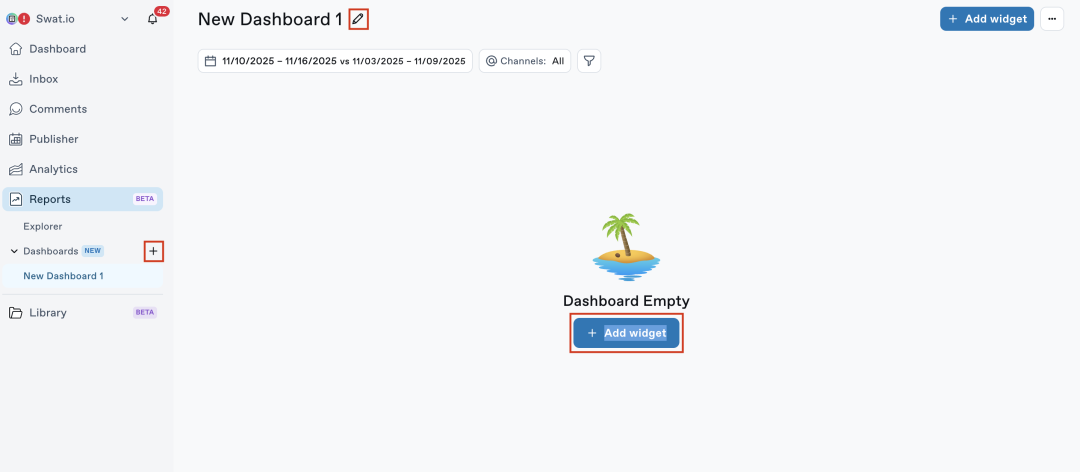
- Add widgets
You can add up to eight widgets per dashboard. Arrange them via drag and drop.
- Adjust widgets & set filters
Adjust the layout of each widget in its settings or resize it by dragging the bottom-right corner. You can also rename widgets at any time using the edit icon. Widgets can be filtered by channel, timeframe, or post type and many more. The filter options depend on the selected widget.

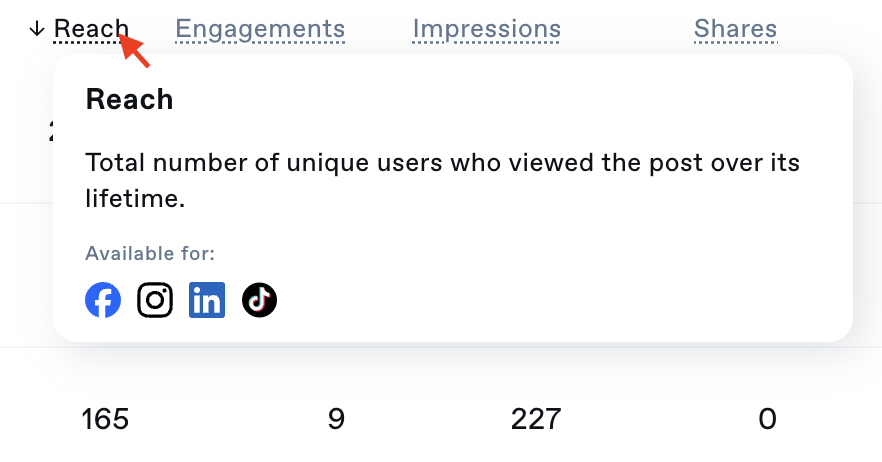
4. It’s important to understand exactly how each metric is calculated. To see an explanation, simply hover over the metric label.
- One dashboard for everyone
When you create a dashboard, it automatically becomes visible to everyone in the workspace. Any changes are immediately reflected for all users.
Limitations:
- Up to 8 widgets per dashboard
- Available in Medium, Large and Custom plans only
- Large and Custom users can create unlimited dashboards; Medium users can create one dashboard
Your benefits
🚀 Exactly what you need:
Set up your dashboard(s) based on your individual needs. With widgets and filters, you can highlight the KPIs that truly matter to you.
🎯 Flexible & scalable:
Whether you’re tracking campaigns, monitoring monthly goals, or providing quick insights to management — you can build the exact dashboard you need.
⚙️ Perfect for team setups:
Dashboards can be viewed or edited by all workspace members. Everyone accesses the same data, ensuring alignment across the team.
Use Cases
Content Performance Dashboard 📹
Regular analysis is key to steering your content performance in the right direction, generating learnings, and applying them to future posts.
Check which channels perform best, where you see the most engagement, and where you achieve the highest reach. The “Performance per Channel” widget is ideal here.
To understand which content formats resonate most, use the “Post Performance” widget. Sort posts by highest engagement rate and filter by channel or post type to quickly discover what truly works for your audience.
Management Reporting Dashboard 📈
Set up a dedicated dashboard for reporting to your management team. With summary widgets, you can provide a quick overview and easily compare performance across time periods (e.g., Q1 vs. Q2). Common focus metrics include reach, engagement rate, and follower growth.
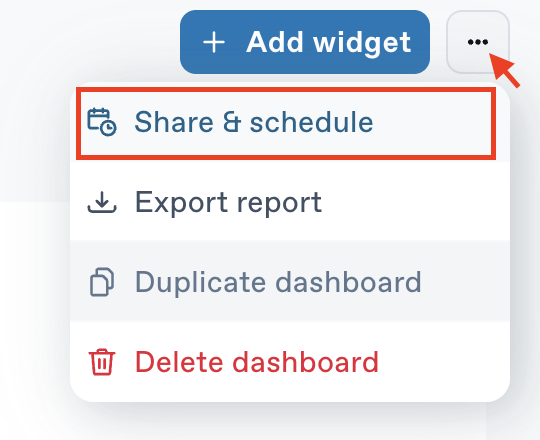
Pro tip: Automate this report and send it to selected recipients at regular intervals.
Campaign Dashboard 📣
Launching a big campaign? Time for a campaign dashboard. Make sure to tag all related posts accordingly. Then apply a campaign filter to your dashboard.
With the “Post Performance per Channel” widget, you’ll instantly see which platforms perform best and where there’s room to optimize.
This allows you to track campaign performance at a glance and easily compare it to past campaigns.
This could also be interesting for you:
If you have any questions, don’t hesitate to contact our Support Team via Chat or support@swat.io.


