 25. August 2026
 Raw data behind every metric: The new Raw Data View in Insights
A spike in your reach catches your eye in the chart right away. The more interesting question comes a second later: which posts are actually behind it? Until now, that meant guessing, filtering or exporting. From now on, a single click takes you from the metric straight to the raw data behind it. The new Raw Data View makes visible which individual posts, tickets and comments really make up your numbers.
How it works
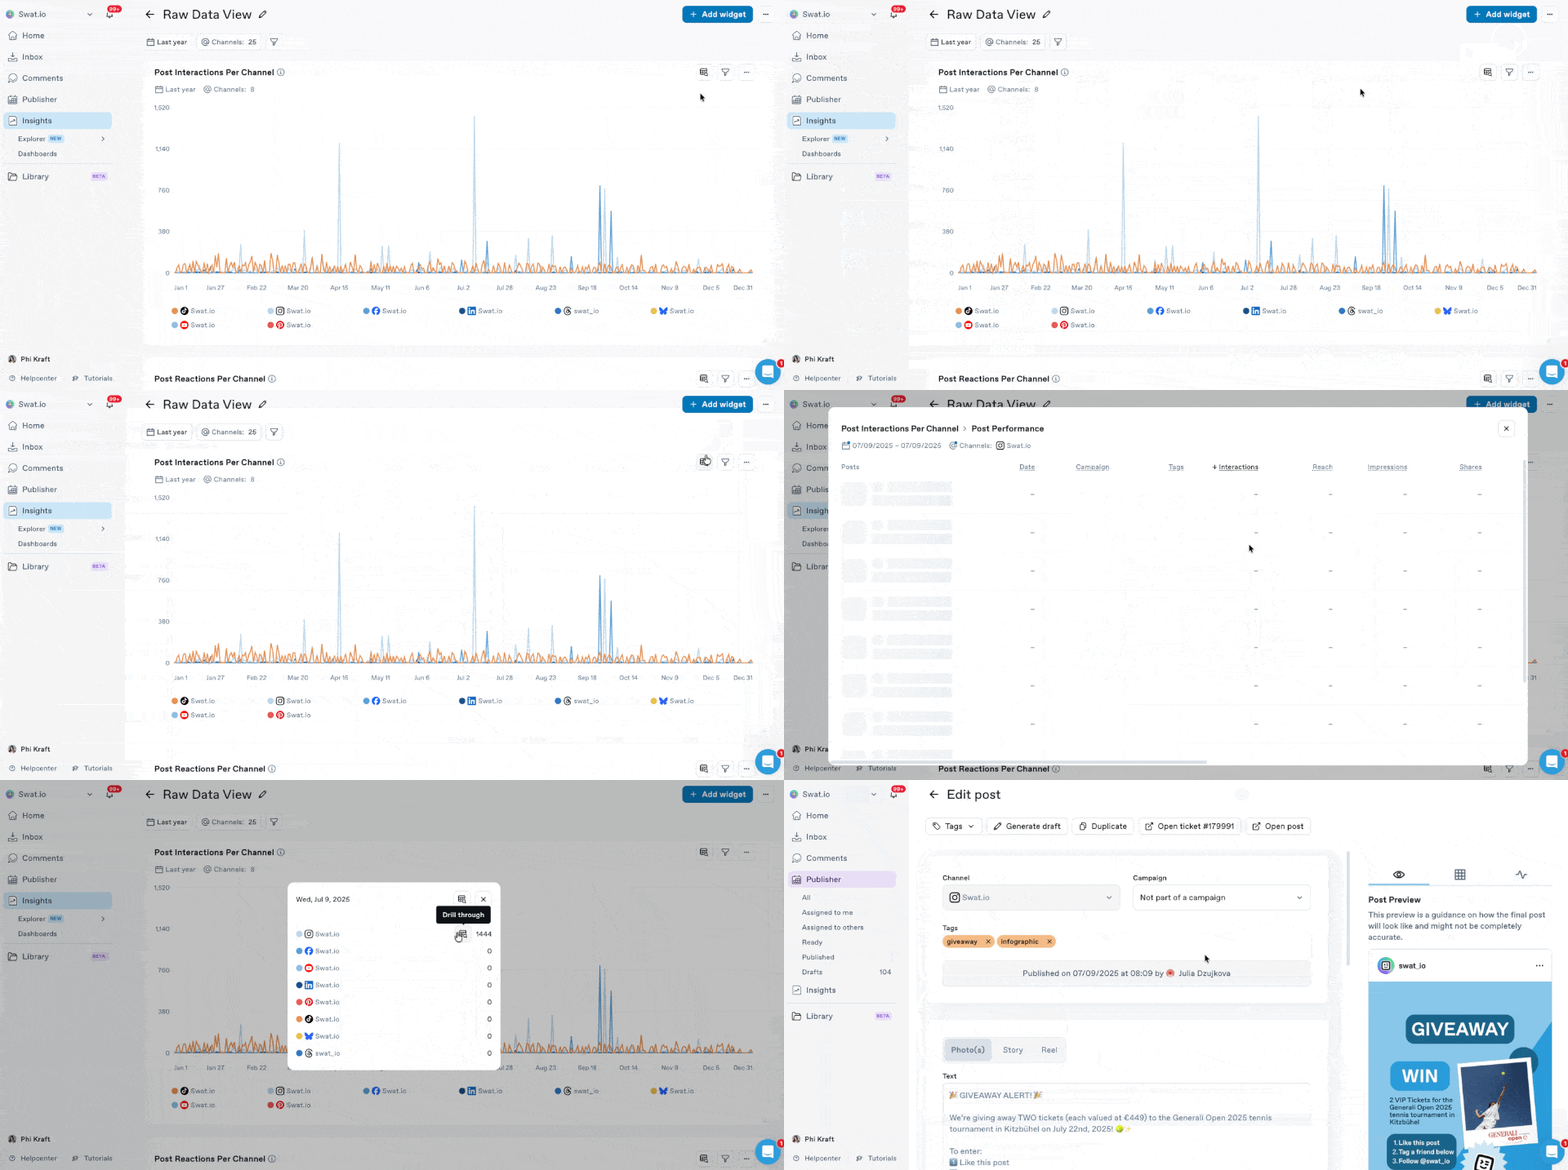
You can open the Raw Data View in three ways, depending on how deep you want to look:
- Whole widget: The table icon in the widget header opens the complete raw data behind that widget. You see every row that is fed into the aggregated metric.
- Single data point: Click a data point directly in a chart, for example the reach peak on a specific day. The Raw Data View opens filtered to exactly that point and shows you which posts or tickets caused the spike.
- Single data point per channel: Here too, you click on the respective data point. In the overview box, hovering over a channel gives you the option to open a Raw Data View for that one channel only.
In the table, each row stands for a specific post or ticket, with all the relevant metrics next to it. Hover over a row and click to jump straight to the post or to the matching ticket.
The Raw Data View is available for many widgets across Post Performance and Ticket Performance, such as “Post Performance Summary”, “Post Impressions Per Channel” or “Tickets Created Per Channel”. You’ll find a list of all widgets with the Raw Data View option in the related help center article.
Please note: The Raw Data View is only available in the Advanced and Premium Insights add-ons.
Good to know
- The Raw Data View inherits your widget’s context, meaning the time range and channels. The filters in the view itself can’t be changed, so the link back to the original metric always stays clear.
Your benefit
Metrics show you the what. The Raw Data View shows you the why. Instead of just seeing a peak, you understand in seconds which posts triggered it, and you can tie your learnings directly to the specific content. No export, no manual digging: you move from the analysis straight to the post, the ticket or the comment, and stay in your analysis flow the whole time. That turns aggregated numbers into solid insights you can use to back up your reporting and plan your next content.
This might be interesting for you as well:
If you have any further questions, don’t hesitate to contact our Support Team via chat or at support@swat.io!


