
 09. January 2023
 How well am I doing in comparison with others? A lot of times, you should avoid asking yourself this question. In Social Media Marketing however, it makes sense to evaluate yourself continuously. After all, the answer to this question provides valuable insights into where you are at with your company.
But how good is good on Facebook, Instagram, or Twitter? We have put together current Social Media benchmarks and Marketing figures, to help you gain perspective on your situation.
Which key figures are truly significant?
Relevant key figures are the basis of every analysis and comparison in Social Media Marketing. Among other numbers, your follower count is highly important – but a large number of followers is only useful if you manage to keep them active and engaged over a long period of time. This is where the Engagement Rate or Interaction Rate comes into play. For your content planning, the Publication Rate (posts per week or per day, respectively) is most informative.
Apart from the Social Media Engagement Rate, there are a number of other interesting KPIs, from Post Reach all the way to Conversion Rate. In order to keep this blog post clear and concise, we have focused on a small number of key factors.
We tell you more about the most important Social Media key figures and KPIs for a thorough analysis in our blog post “25 Social Media Key Figures You Must Know”.
Up-to-date numbers for relevant Social Media Platforms
Facebook User Number
Despite all their scandals in recent history, Facebook still plays a major part in every Social Media Strategy. This is illustrated by the following numbers:
- In July 2022 Facebook reported 2.9 billion active users worldwide, 1.9 billion of whom are active daily.
- In Europe, 407 million people use the social network every month.
- According to estimates, more than 31 million people in Germany actively use Facebook.
- The majority of these come from the 25 – 34 age group.
- The accounts with the most followers belong primarily to prominent soccer players and clubs, while Volkswagen Motorsport is in 17th place with over 6 million followers, and Amazon Germany is in 24th place with just over 4 million.
- The situation in Austria was similar in 2017. At that time, most accounts were held by users in the age group between 25 and 34.
Facebook Posts per Week
The Publication Rate on Facebook differs significantly by industry. In the beginning of 2022, Rival IQ compared the average posts-per-week rate among 12 different industries and arrived at the following conclusions.

If your company is not a media company, you can therefore use an average publication rate of 3 to 7 posts per week as a guideline. The publication rate increased slightly compared to the previous year.
So how often is often enough? Here, recommendations range from 1 – 2 times to 5 times a day. Which frequency is best in your case can only be found out through trial and error.
But no matter what result you come to, quality is more important than quantity. Post less frequently and make sure that your posts encourage interaction with your community.
Facebook Engagement Rate
A large follower count and impressive Publication Rate count only for little, if nobody reacts to your posts. This is why the so-called Engagement Rate, or Interaction Rate, is one of the most important key figures in Social Media Marketing analyses. You can calculate it by dividing the average number of interactions per post by the number of your followers.
Here too, Rival IQ’s results for Facebook are very clear:

Compared to the previous year, the interaction rate has decreased.
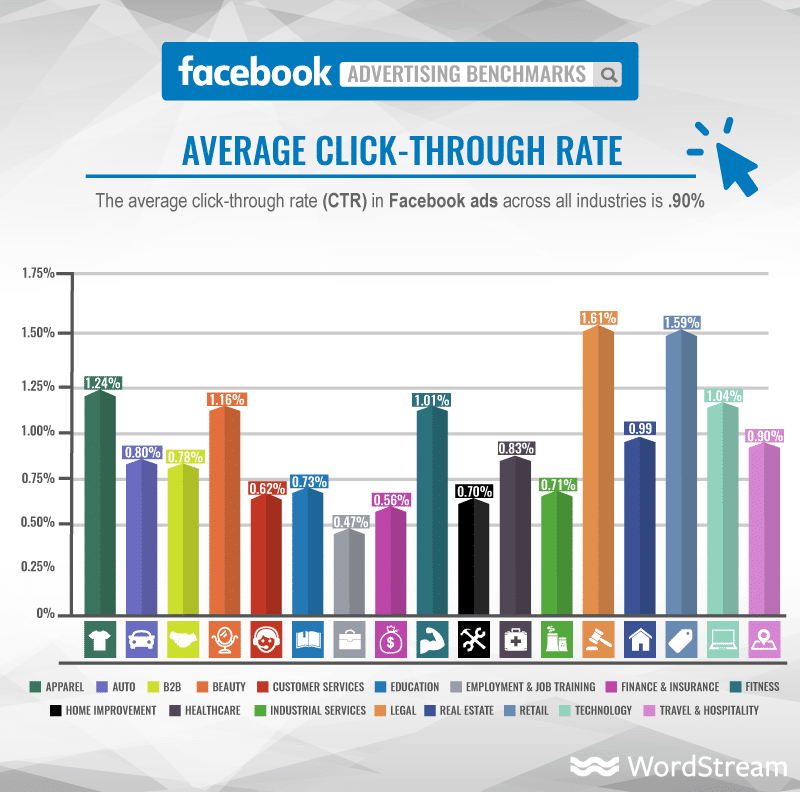
Benchmarks for Facebook Ads
In times of shrinking organic reach, paid ads have been gaining traction and quickly become a set part of every successful Facebook Marketing strategy. In this context, knowing what a good Click-Through Rate is, is key. Wordstream answers this question as follows:
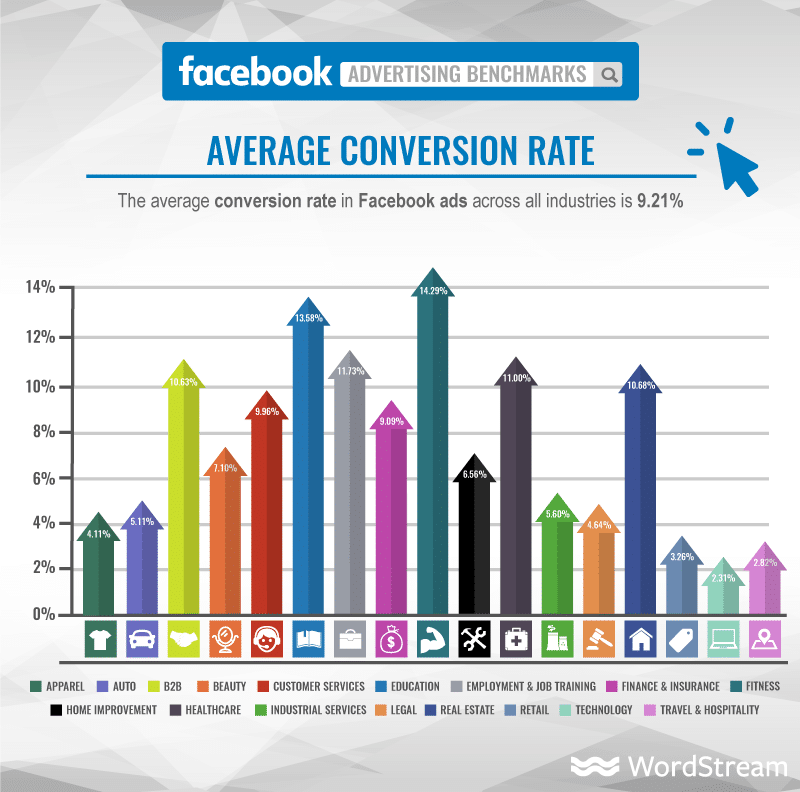
The average Conversion Rate per industry looks as follows:
You are new to Social Media Monitoring? You find everything you need to know to get started successfully in our “Beginner’s Guide to Social Media Monitoring”. Download it now for free!
Instagram User numbers
Instagram has been more than just the rising star among social networks for a while now, but it still distinguishes itself by its rapid growth. In 2022, Instagram reached more than 2 billion monthly active users. Most users are 18 to 34 years old.
Don’t feel disappointed if your company doesn’t have more than 50.000 followers on Instagram right now. Only 8 percent of users can claim this number of followers. On the flip side, 70 percent of Instagram users have less than 1.000 followers. Above all, quality is still more important than quantity.
Instagram Posts per Week
How often companies post also varies by industry on Instagram. According to Rival IQ, the leaders are sports teams, media, fashion, and beauty. Companies from the software and tech sectors post the least, which could be due to the fact that it is more difficult to create visually captivating posts here.
Currently, a guideline of 4-5 posts per week has been established, which smaller companies can follow. Again, it depends on the individual case which frequency is best. More important than the sheer number of posts is a consistent publication rate. Because your “audience” also gets used to this. So it only makes sense to post 4 posts a week if you can keep this up over a longer period of time.

Instagram Engagement Rate
The following chart illustrates the fact that a higher Posting Rate does not automatically lead to more interaction. It also shows differences across various industries. Additionally, as several other studies, it suggests that Instagram is superior to Facebook in terms of interaction.

Instagram Hashtags
Hashtags play a quintessential role on Instagram. How useful they are, and for whom, has been disputed. An average post has between 3 and 7 hashtags. Some studies recommend using about 9 hashtags per post, in order to boost interaction. A Quintly study, however, arrives at a different conclusion. According to their findings, for accounts with 1.000 up to 10 million followers it’s best to not use hashtags at all. Only smaller and larger profiles truly profit from using hashtags. Fanpage Karma, on the other hand, attributes the most reach to posts with 30 hashtags. It’s best to try it out for yourself to see what works for your channel.
Benchmarks for Instagram Ads
According to SmartInsights, the performance of Instagram ads has dropped significantly in 2021. The average CTR for ads in the feed is currently 0.22 percent, for Stories 0.33.
Twitter User numbers
As a true original among the big Social Media platforms, Twitter follows its own rules, starting with the fact that only a fraction of active users actually tweet themselves. In quarter 1, 2021, Twitter had 237.8 daily active users. Keep in mind that for some time now Twitter has only been counting monetizable users, i.e. those who can also be served ads.
41.5 million of them come from the USA. Since Twitter is especially popular among opinion leaders, the platform is worth being taken into consideration for your Social Media Marketing strategy.
Twitter Posts per Week
Looking at Rival IQ’s results for Twitter, the average posting rate is around five tweets per day. The media industry is a clear exception. Here, more than 75 tweets are the norm. Overall, posting frequency increased by 13 percent, according to Rival IQ.

Twitter Engagement Rate
Will you be rewarded with more interaction if you post more? Not on Twitter, according to Rival IQ.

Numbers such as more than 1500 Likes and Retweets per Tweet on average are primarily indicators of the high Interaction Rates of a small number of exceptionally popular accounts and their large follower base.
Twitter Hashtags
It’s hard to imagine Twitter without hashtags. But do they really increase the interaction rate? According to Twitter itself, the opposite is the case. According to this, tweets without hashtags perform significantly better on average.
Analysis is easy with the right tools
Benchmarks and Social Media stats such as the ones shown in this blog post offer a great starting point for gaining an overview quickly. However, in order to analyse your performance in-depth, it is key to compare yourself to your competitors and keep the geographical context in mind as well. Tools for competitor analysis don’t just filter for the most important key figures. They also help you in learning from others’ failures and successes.
Swat.io keeps you in the know about what is being said about you and your competitors in Social Media. Start a free trial now and discover new ways of doing Analyses, Content Creation, and Social Customer Service.


